The increase in discharge in rivers due to combined sewer overflow (CSO) causes not only a pollution effect
but also a direct physical impact in the form of an increased bottom shear stress. If the shear stress exceeds a
certain threshold that is determined predominately by the properties of the river bottom, erosion starts. The
finer the bottom material, the more vulnerable it is for erosion (e.g., a river with a sand bottom is more affected
by acute hydraulic impacts than one where the bottom is stabilised with coarse gravel).
It is clear that erosion events in rivers are not only caused by anthropogenic impacts but also by extreme
flooding from the natural catchment area. However, urban drainage systems usually lead to a significant increase in the number of events. It is not the single erosion event but the frequent occurrence that poses the
problem for the aquatic ecosystem. Accordingly, Frutiger et al. (2000) propose a certain number of events
(between 0.5 and 10 events per year, depending on the morphological and biological state of the river) whose
exceedance indicates that the river is affected.
REBEKA uses the empirical model of Meyer–Peter to calculate the critical bottom shear stress for
erosion (τcrit) for the given situation. The actual bottom shear stress (τ) is then computed dynamically by assuming quasi steady-state conditions, that is uniform flow conditions, in each time step. Key parameters
in this model are the mean (dm) and the 90% (d90) value of the grain size distribution of the bottom material.
![]()
where Fs is the entrainment function, R is the hydraulic radius (L), J is the slope (-), k is the
roughness coefficient (L1/3 T-1), ρs and ρ are the densities of the bottom material and of water (ML-3), g is the acceleration of gravity (LT-2) and dm, d90 is the parameter of grain size distribution (L). Fs is a function of the Reynolds number (Shields' diagram) but assumed to be constant (0.047) in the model of Meyer-Peter.
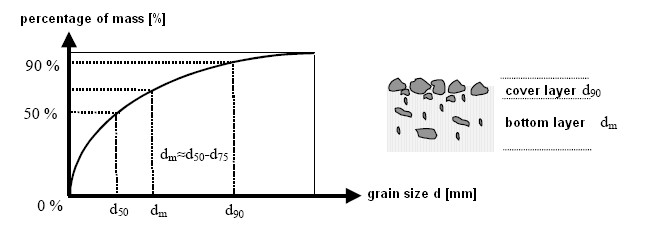
Figure: determination of dm and d90 by means of a particle size distribution curve
The program checks for each rainfall event if τ > τcrit and counts these critical events. The number of critical events per year is shown as result.