Calculated TSS (total suspended solids) loads are also displayed as cumulative probability curves. The interpretation of the curves is identical to those of the critical events for bedload and NH3.
Loads are indicated in kg per year.
The blue curve shows the TSS load from the combined sewer system to the WWTP during rain weather resp. during simulation time, i.e. loads during dry weather are only partly included.
The red curve shows the TSS load stored in the treatment structure (e.g. CSO tank) of the combined sewer system.
The green curve shows the TSS load from the combined sewer system to the receiving water.
The grey curve shows the TSS load from the separate sewer system to the receiving water.
The orange curve shows the TSS load stored in the treatment structure of the separate sewer system.
The results of the deterministic simulation are drawn as large points.
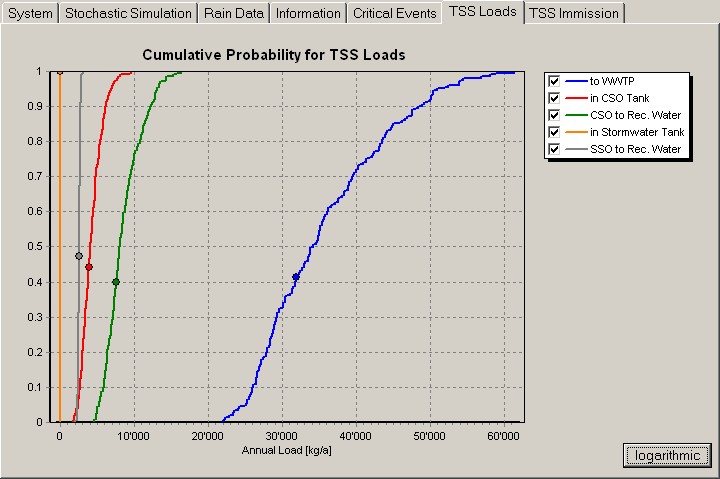
If you uncheck a curve in the legend then this curve is hidden in the chart. The x-axis maximum is adjusted.
The button "logarithmic / linear" allows to switch between logarithmic and linear x-axis.
Mouse right click enables a popup menu that allows to copy the chart to the clipboard, to save it to a file or to print it.