Accumulation of suspended solids on the receiving water bed is calculated from TSS concentration. The model accounts for accumulation and erosion of particulate matter and decay of the organic part (during dry periods) as well as turbidity caused by suspended solids. The computed quantity to assess impacts by TSS is the percentage of time where a critical density of accumulated particulate matter is exceeded.
If you move with the cursor over the corresponding curve then an interpretation of the current curve value is shown under the legend.
The critical densities are taken from literature. They can be changed under Settings / TSS Immission Thresholds (change only if other values are recommended).
The following percentages of time should not be exceeded:
Critical value for colmation (acc. TSS > 625 g/m2) |
20 % |
|
Critical value for toxicity (acc. TSS > 25 g/m2) |
5 % |
|
Critical oxygen depletion (acc. org. matter > 2.4 g/m2) |
10 % |
(0% from Sept. to March) |
These thresholds are displayed as vertical dashed lines. Their values can be changed under Settings / STORM Thresholds. The probability of keeping the threshold can be read at the intersection of the threshold line with the cumulative probability curve (for the example below: 1.0 for colmation, 0.5 for toxicity and 0.83 for oxygen depletion.
The number of events with critical turbidity caused by TSS in the receiving water are displayed in tab Critical Events
.
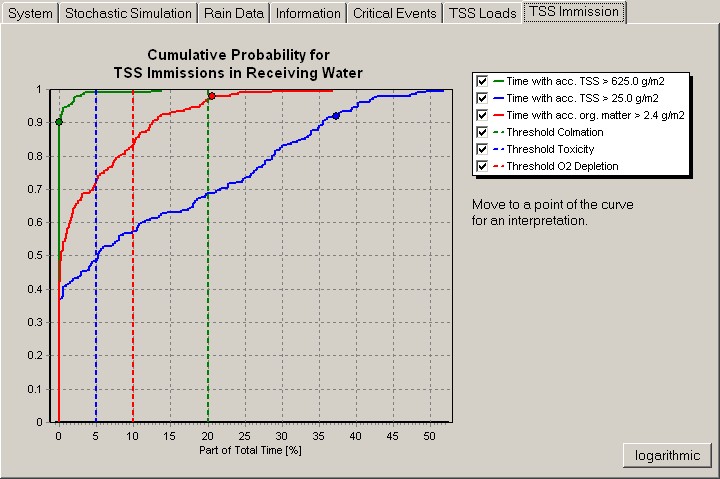
Results of the deterministic simulation are drawn as large points.
If you uncheck a curve in the legend then this curve is hidden in the chart. The x-axis maximum is adjusted.
The button "logarithmic / linear" allows to switch between logarithmic and linear x-axis.
Mouse right click enables a popup menu that allows to copy the chart to the clipboard, to save it to a file or to print it.